Introduction to single-cell RNA-seq
Bulk RNA-seq
- A major breakthrough (replaced microarrays) in the late 00's and has been widely used since
- Measures the average expression level for each gene across a large population of input cells
- Useful for comparative transcriptomics, e.g. samples of the same tissue from different species
- Useful for quantifying expression signatures from ensembles, e.g. in disease studies
- Insufficient for studying heterogeneous systems, e.g. early development studies, complex tissues (brain)
- Does not provide insights into the stochastic nature of gene expression
scRNA-seq
- A new technology, first publication by Tang et al. in 2009
- Did not gain widespread popularity until ~2014 when new protocols and lower sequencing costs made it more accessible
- Measures the distribution of expression levels for each gene across a population of cells
- Allows us to study new biological questions in which cell-specific changes in transcriptome are important, e.g. cell type identification, heterogeneity of cell responses, stochasticity of gene expression, inference of gene regulatory networks across the cells
- Datasets range from $10^2$ to $10^6$ cells and increase in size every year
- Currently there are several different protocols in use, e.g. SMART-seq2 (Picelli, 2013), CELL-seq (Hashimshony, 2012) and Drop-seq (Macosko, 2015)
- There are also commercial platforms available, including the Fluidigm C1, Wafergen ICELL8 and the 10X Genomics Chromium
- Several computational analysis methods from bulk RNA-seq can be used
- In most cases computational analysis requires adaptation of the existing methods or development of new ones
Workflow
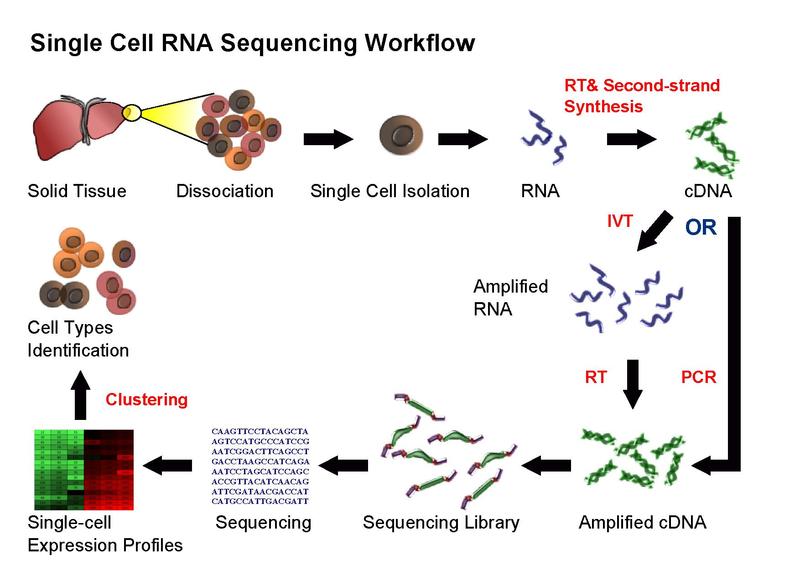
Overall, experimental scRNA-seq protocols are similar to the methods used for bulk RNA-seq. We will be discussing some of the most common approaches in the next chapter.
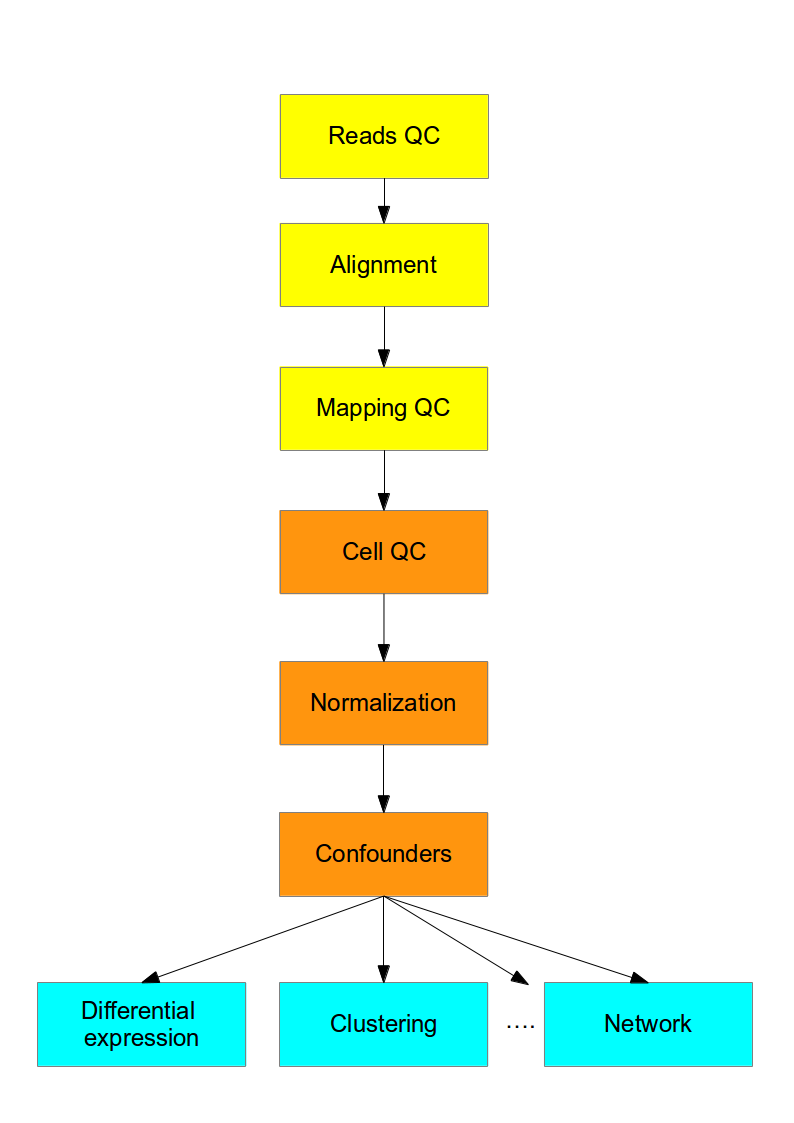
Computational Analysis
This course is concerned with the computational analysis of the data obtained from scRNA-seq experiments. The first steps (yellow) are general for any highthroughput sequencing data. Later steps (orange) require a mix of existing RNASeq analysis methods and novel methods to address the technical difference of scRNASeq. Finally the biological interpretation (blue) should be analyzed with methods specifically developed for scRNASeq.
We recommend the recent review of scRNA-seq analysis by Luecken and Theis.
Today, there are also several different platforms available for carrying out one or more steps in the flowchart above. The most popular include:
- Seurat is an R package designed for QC, analysis, and exploration of single cell RNA-seq data.
- Bioconductor is a open-source, open-development R project for the analysis of high-throughput genomics data, including packages for the analysis of single-cell data.
- Scanpy is a Python package similar to Seurat
Challenges
The main difference between bulk and single cell RNA-seq is that each sequencing library represents a single cell, instead of a population of cells. Therefore, significant attention has to be paid to comparison of the results from different cells (sequencing libraries). The main sources of discrepancy between the libraries are:
- Amplification (up to 1 million fold)
- Gene 'dropouts' in which a gene is observed at a moderate expression level in one cell but is not detected in another cell (Kharchenko, 2014).
In both cases the discrepancies are introduced due to low starting amounts of transcripts since the RNA comes from one cell only. Improving the transcript capture efficiency and reducing the amplification bias are currently active areas of research. However, as we shall see in this course, it is possible to alleviate some of these issues through proper normalization and corrections.