Neuroglancer Quickstart
Neuroglancer is an open-source, web-based visualization tool utilized by the CryoET Data Portal for viewing tomograms and their annotations directly in the browser. Neuroglancer supports arbitrary (non axis-aligned) cross-sectional views of volumetric data and 3D meshes, which are essential features for exploring CryoET data.
Tour of Neuroglancer
Tomograms along with their annotations can be viewed in Neuroglancer using the view tomogram buttons found in the runs table on dataset detail pages and on the header of run detail pages.


These buttons will open a separate tab with the tomogram along with any annotations preloaded into Neuroglancer. The data may take a few moments to load.
An example of the default view in Neuroglancer with some features highlighted is shown below.
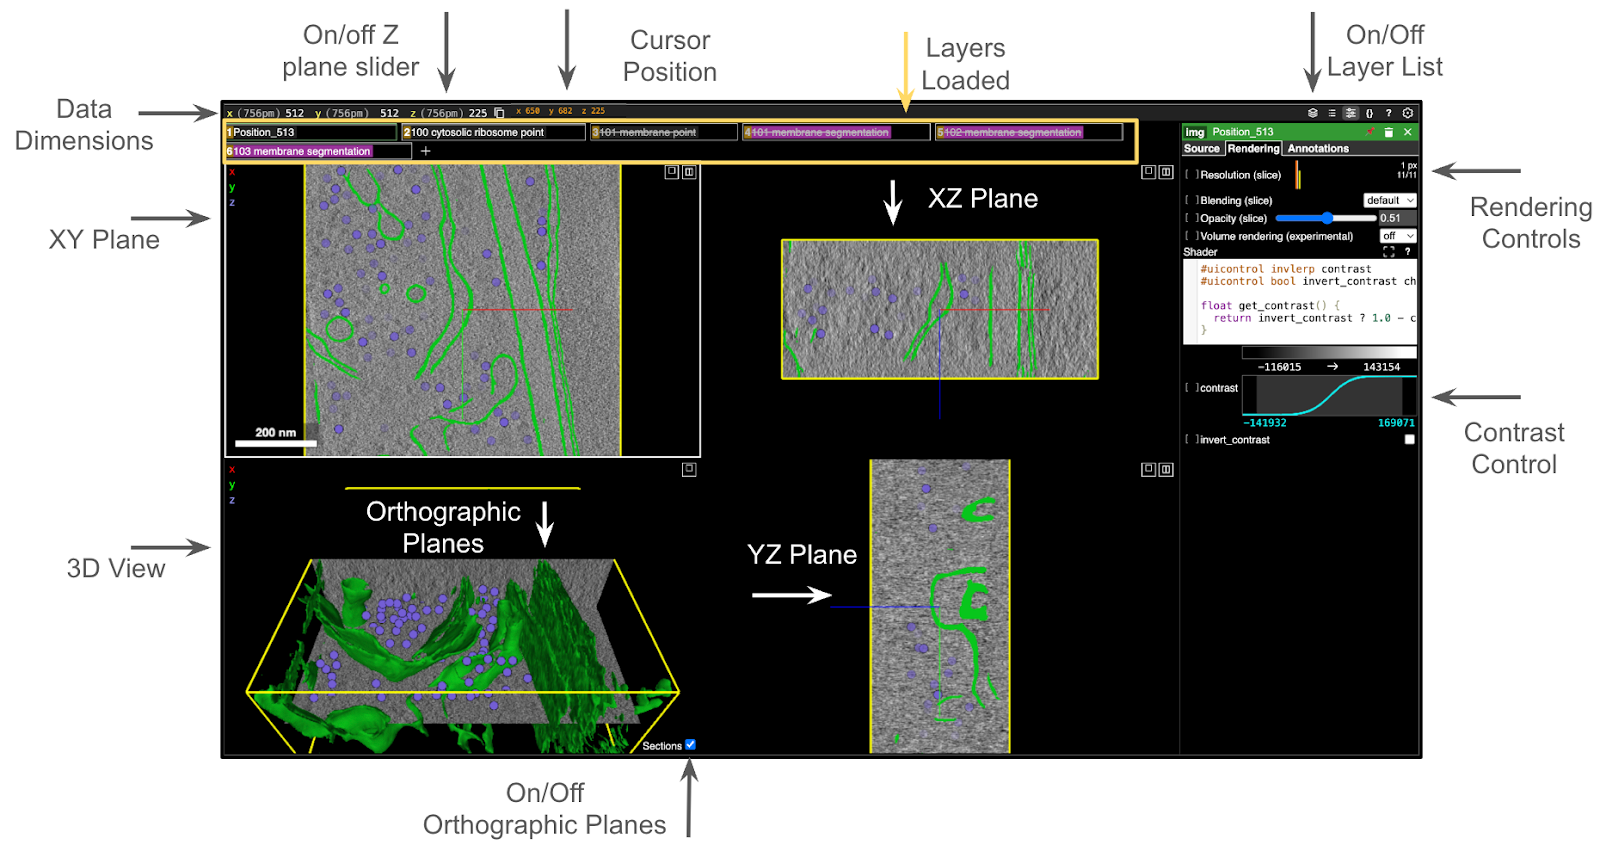
The 3D tomogram is displayed on the lower left corner of the canvas with orthographic planes shown in the 3D volume as opaque slices and as separated 2D slices with the XY, XZ, and YZ planes in the upper left, upper right, and lower right of the canvas, respectively. The Sections checkbox can be used to turn off the orthographic plane view on the 3D volume, since those planes obscure part of the tomogram when turned on. Data dimensions in physical units and pixels as well as the location of the cursor are displayed on the upper left bar. Click on X, Y, or Z to open a slider for moving through the 2D slices.
Useful gestures and hotkeys for navigating Neuroglancer are in the table below.
Action |
Gesture / Hotkey |
|---|---|
Zoom in / out of the 2D images |
CTRL + scroll or Pinch |
Slice through 3D data |
Scroll |
Rotate 3D Volume |
Left-Click + drag (in 3D panel) |
Turn on / off layer |
Click on the layer |
Oblique slicing |
Shift + click and rotate |
Open Rendering Controls for a layer |
CTRL + click on the layer |
Pan |
Left-click + drag (in 2D panel) |
Reset View |
“Z” |
Open Help Menu |
“H” |
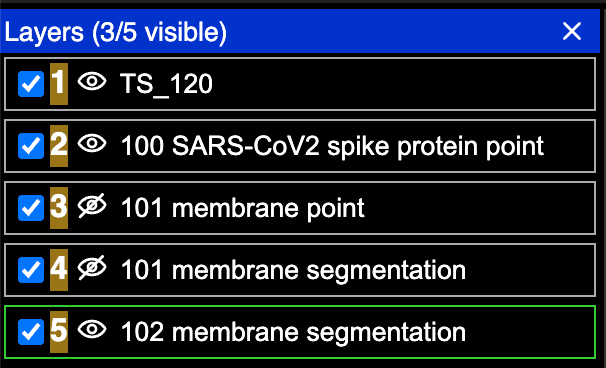
All of the data loaded is displayed in the upper bar with layers that are not currently visible displayed with strikethrough text. Use the button on the upper right corner of the viewer to change the view to display all the data loaded as a layer list. The eye icons in the layer list can be used to toggle on and off layers.
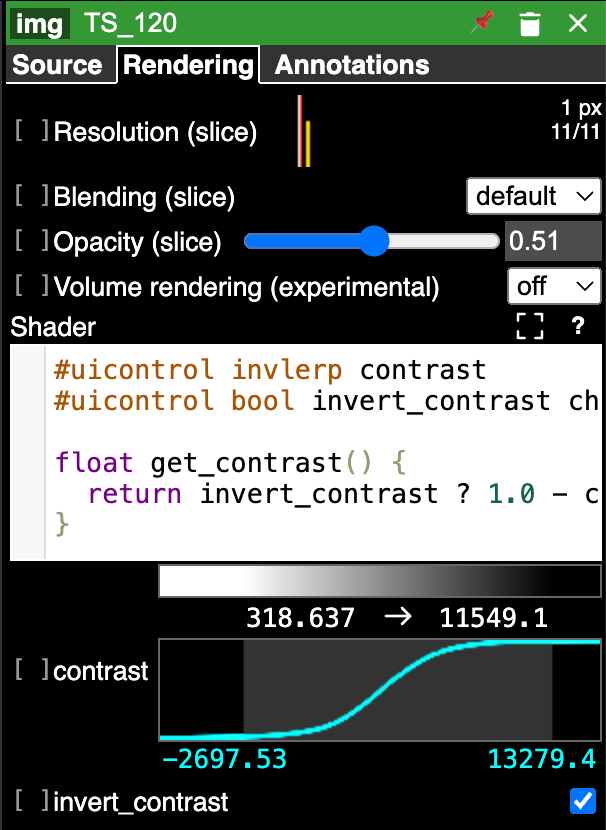
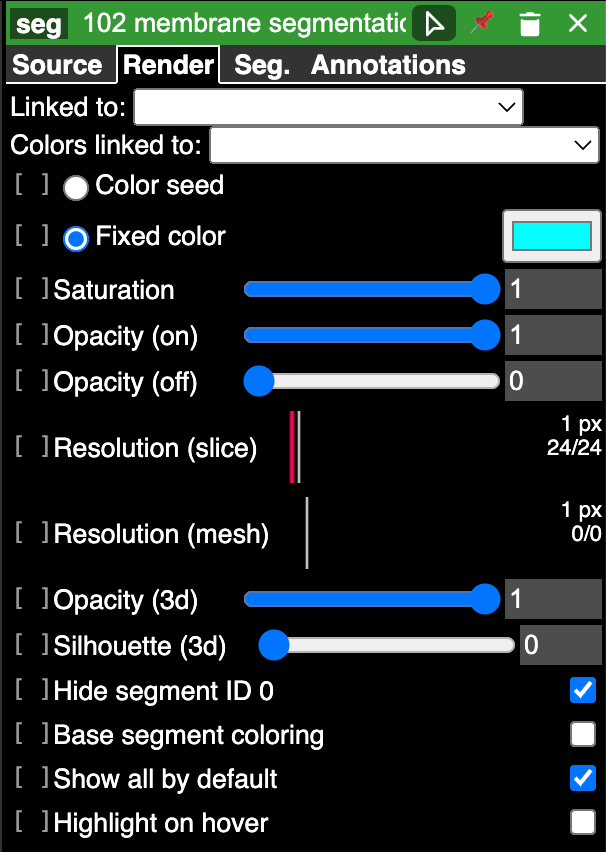
The control panel on the right hand side has multiple tabs. Note that the Annotations tab is for adding additional annotations to the canvas and does not contain controls for viewing annotations from the CryoET Data Portal. The Rendering tab displays controls for adjusting the visualization settings for the selected layer. CTRL + click on a layer to open its Rendering controls tab.
For 3D volumes, volume rendering can be turned on using the Volume rendering (experimental) dropdown in the Rendering controls. This will display the full 3D volume in the lower left panel of the canvas. Contrast can be adjusted by directly inputting desired values or dragging the lines on the contrast plot, and other visualization settings, like blending and opacity, can be set as well.
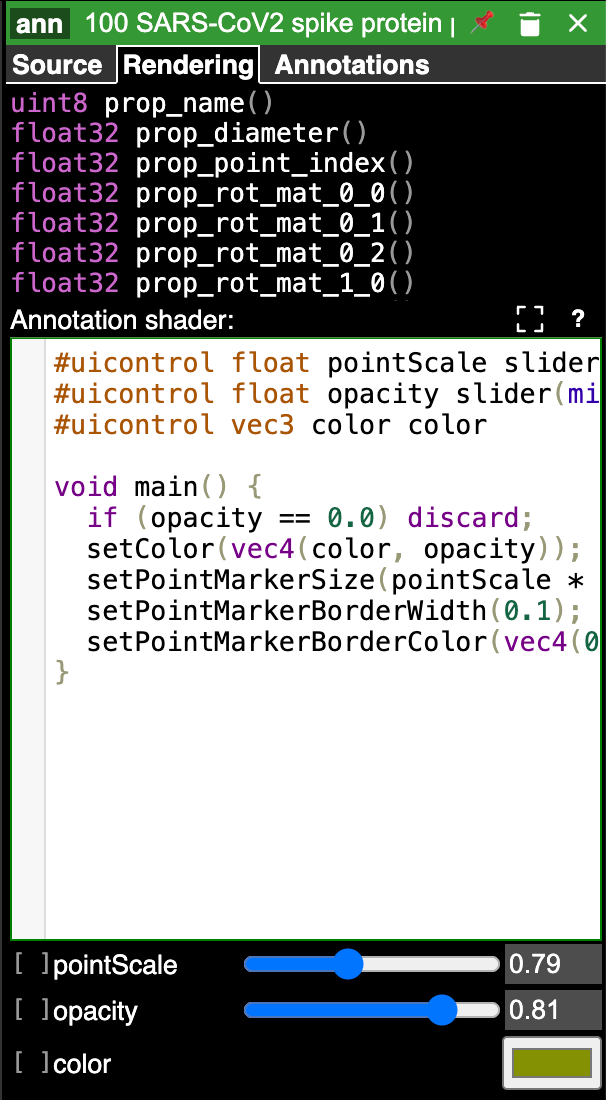
For point annotations, the size of the point markers, opacity, and color of the points can be set in the bottom section of the rendering control panel.
For segmentation masks, the opacity of the labels and other display settings can be set in the rendering control panel.
Quick Tips / FAQ
Scrolling changes the plane, but not the Zoom level.
Shift + click to rotate the image for oblique slicing. This can be used when the lamella from the CryoET 3D data needs adjustment to be perpendicular to the desired plane for slicing.
Tomograms and annotations are pre-loaded into Neuroglancer but some annotations may not be visible by default. Click on a layer with strikethrough text to make the layer visible in the canvas.
The Annotations tab in Neuroglancer is for adding additional annotations and not related to the annotations provided on the CryoET Data Portal. Use the Rendering tab to adjust annotations pre-loaded in Neuroglancer.
Layers highlighted in magenta can be hidden in the 3D mesh by double clicking the segmentation in the 2D view. Double clicking the 2D segmentation will make it re-appear in the 3D viewer.
For more information on Neuroglancer, check out the documentation from Connectomics here.