Benchmarks of single-cell Census models
Published: July 11th, 2024
Updated: July 19th, 2024. Model names fixed.
By: Emanuele Bezzi, Pablo Garcia-Nieto
In 2023, the Census team released a series of cells embeddings (available at the Census Model page) compatible with the Census LTS version census_version="2023-12-15", so that users can access and download for any slice of Census data.
These embeddings were generated via different large-scale models; in this article we present the results of light benchmarking of them. We hope that these benchmarks provide an initial picture to users on, 1) the strength of biological signal captured by these embeddings and, 2) the level of batch correction they exert.
We advise our users to consider these benchmarks as first-pass information and we recommend further benchmarking for a more comprehensive view of the embeddings and for task-oriented applications.
The benchmarks were run on the following embeddings:
scVI latent spaces from a model trained on all Census data.
Fine-tuned Geneformer.
scGPT.
Universal Cell Embeddings (UCE).
For more details on each model please see the Census Model page.
Accessing the embeddings included in the benchmark
Please the Census Model page for full details. Shortly, you can see the embeddings available for the Census LTS version census_version="2023-12-15" using the Census API as follows.
import cellxgene_census.experimental.get_all_available_embeddings
cellxgene_census.experimental.get_all_available_embeddings(census_version="2023-12-15")
With the exception of NMF factors, all other human embeddings were included in the benchmarks below. If you would want to access the embeddings for any slice of data you can utilize the parameter obs_embeddings from theget_anndata() method of the Census API, for example:
import cellxgene_census
census = cellxgene_census.open_soma(census_version="2023-12-15")
adata = cellxgene_census.get_anndata(
    census,
    organism = "homo_sapiens",
    measurement_name = "RNA",
    obs_value_filter = "tissue_general == 'central nervous system'",
    obs_embeddings = ["scvi"]
)
Benchmarks of Census Embeddings
About the benchmarks
We executed a series of benchmarks falling into two general types: one to assess the level of biological signal contained in the embeddings, and the second to measure the level of correction for batch effects. In general, the utility of the embeddings increases as a function of these two set of benchmarks.
For each of the type, the benchmarks can be further subdivided by their “mode”. A series of metrics assess the embedding space, and the others assess the capacity of the embeddings to predict labels.
The table below shows a breakdown of the benchmarks we used in this report.
| Type | Mode | Metric | Description |
|---|---|---|---|
| Bio-conservation | Embedding Space |
leiden_nmi |
Normalized Mutual Information of biological labels and leiden clusters. Described in Luecken et al. and implemented in scib-metrics. |
leiden_ari |
Adjusted Rand Index of biological labels and leiden clusters. Described in Luecken et al. and implemented in scib-metrics. | ||
silhouette_label |
Silhouette score with respect to biological labels. Described in Luecken et al. and implemented in scib-metrics. | ||
| Label Classifier |
classifier_svm |
Accuracy of biological label prediction using a SVM (60/40 train/test split). Implemented here. | |
classifier_forest |
Accuracy of biological label prediction using a Random Forest classifier (60/40 train/test split). Implemented here. | ||
classifier_lr |
Accuracy of biological label prediction using a Logistic regression classifier (60/40 train/test split). Implemented here. | ||
| Batch-correction | Embedding Space |
silhouette_batch |
1- silhouette score with respect to biological labels. Described in Luecken et al. and implemented in scib-metrics. |
entropy |
Average of neighborhood entropy of batch labels per cell. Implemented here. | ||
| Label Classifier |
classifier_svm |
1 - accuracy of batch label prediction using a SVM (60/40 train/test split). Implemented here. | |
classifier_forest |
1 - accuracy of batch label prediction using a Random Forest classifier (60/40 train/test split). Implemented here. | ||
classifier_lr |
1 - accuracy of batch label prediction using a Logistic regression classifier (60/40 train/test split). Implemented here. |
Table 1: List of benchmarks.
Benchmark results
As reminder the benchmarks were run on the following embeddings:
scVI latent spaces from a model trained on all Census data.
Fine-tuned Geneformer.
scGPT.
Universal Cell Embeddings (UCE).
Summary
The following are averages for all the metrics shown in the following sections.

Figure 1. Summary of all benchmarks. Numerical averages across the metric types and modes from all bio- and batch-labels across the tissues in this report.
Bio-conservation
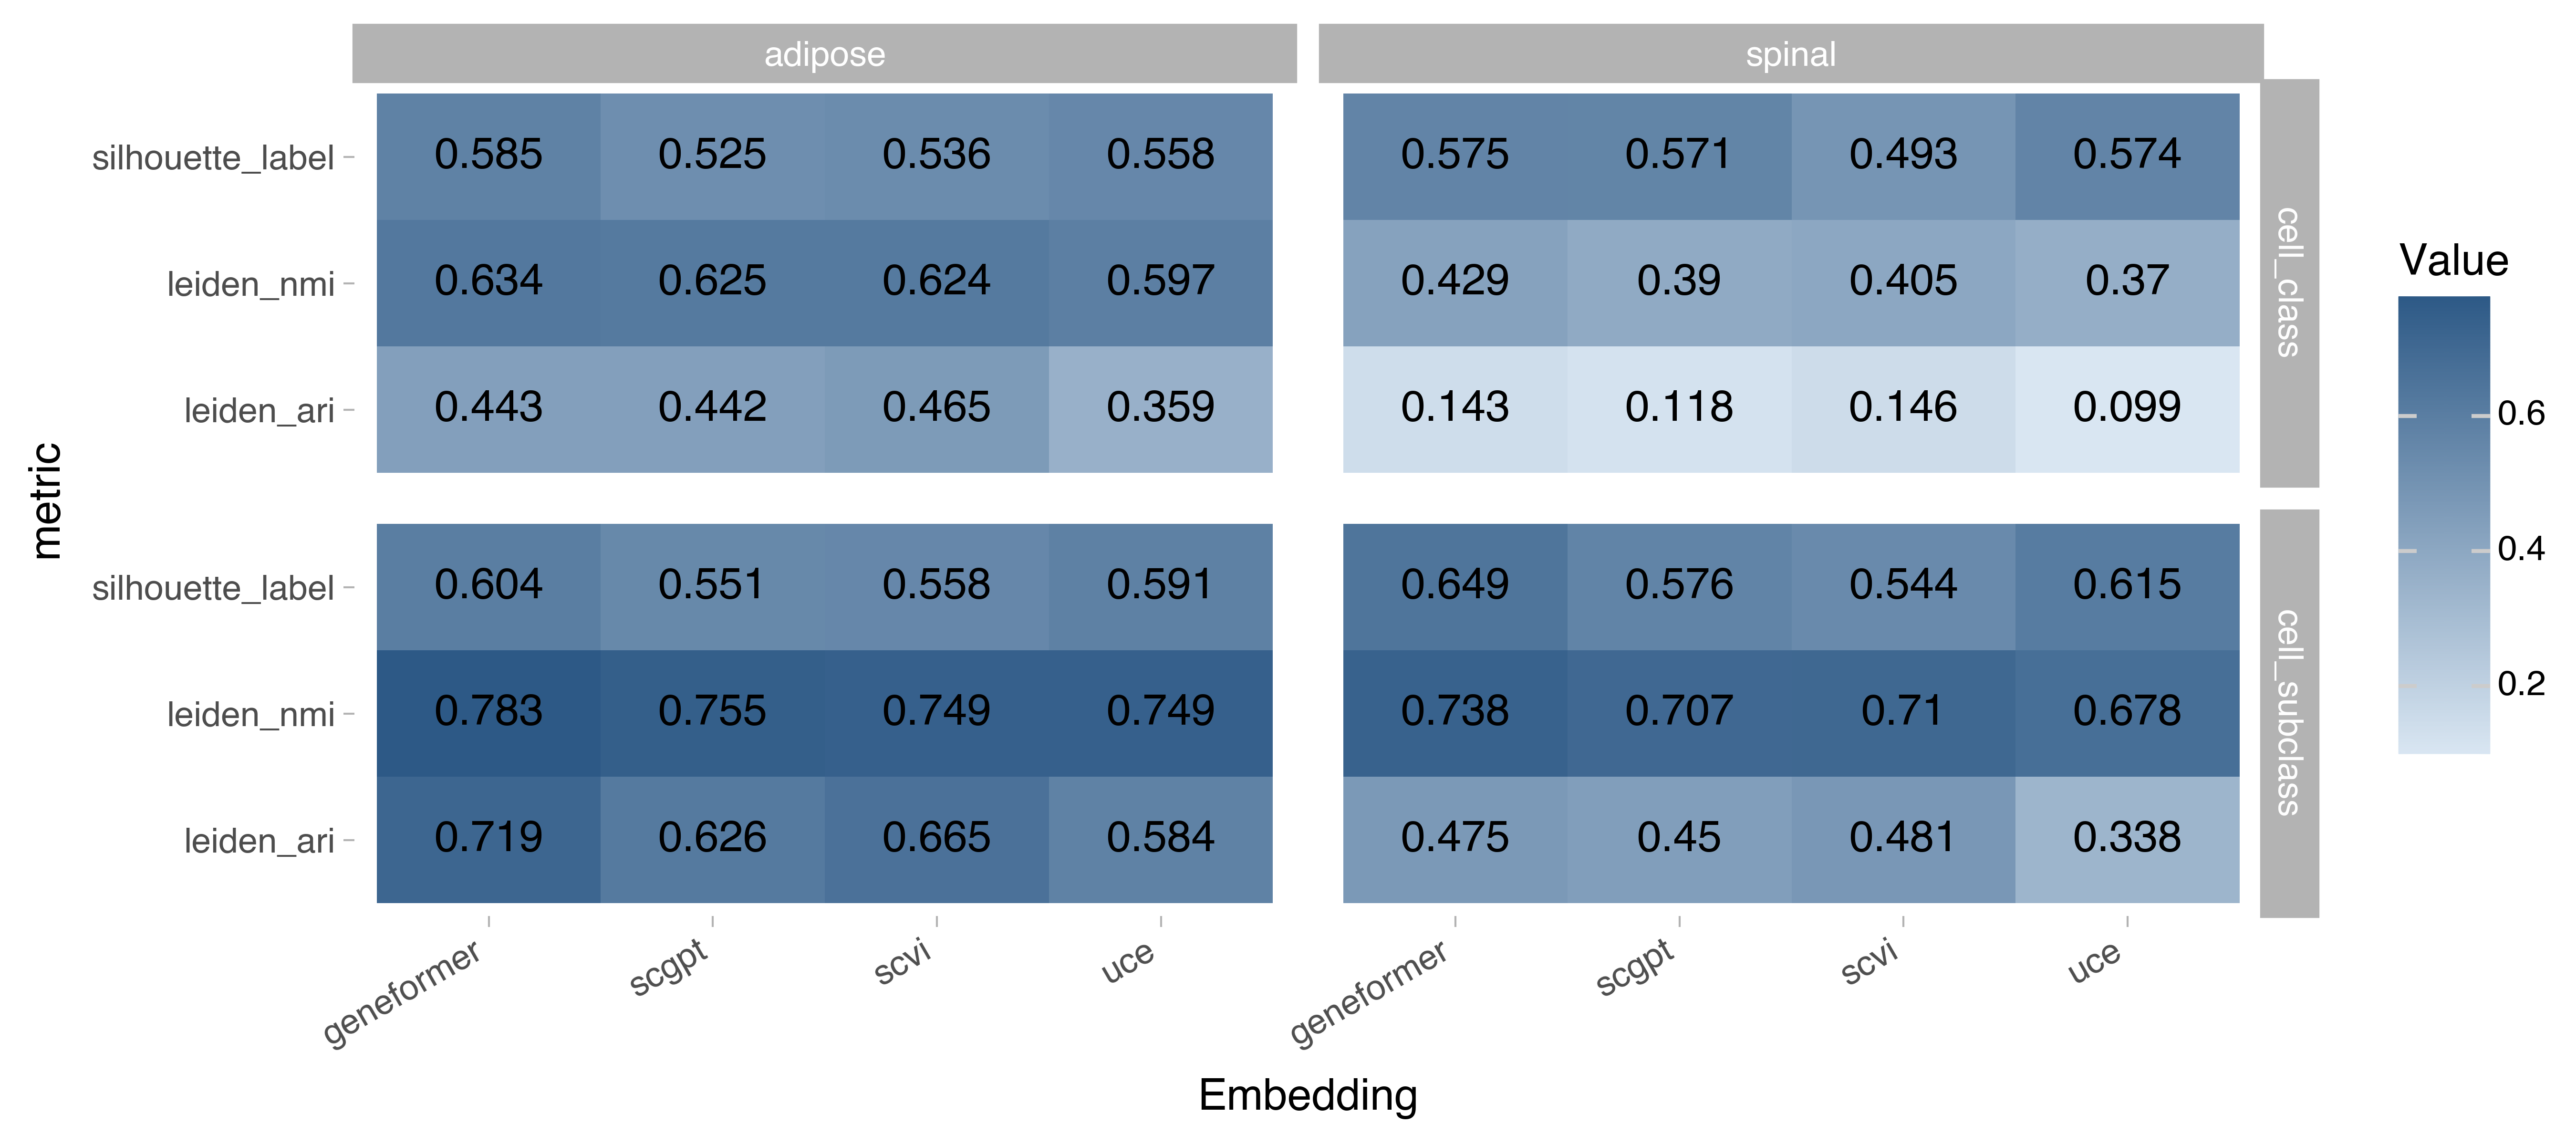
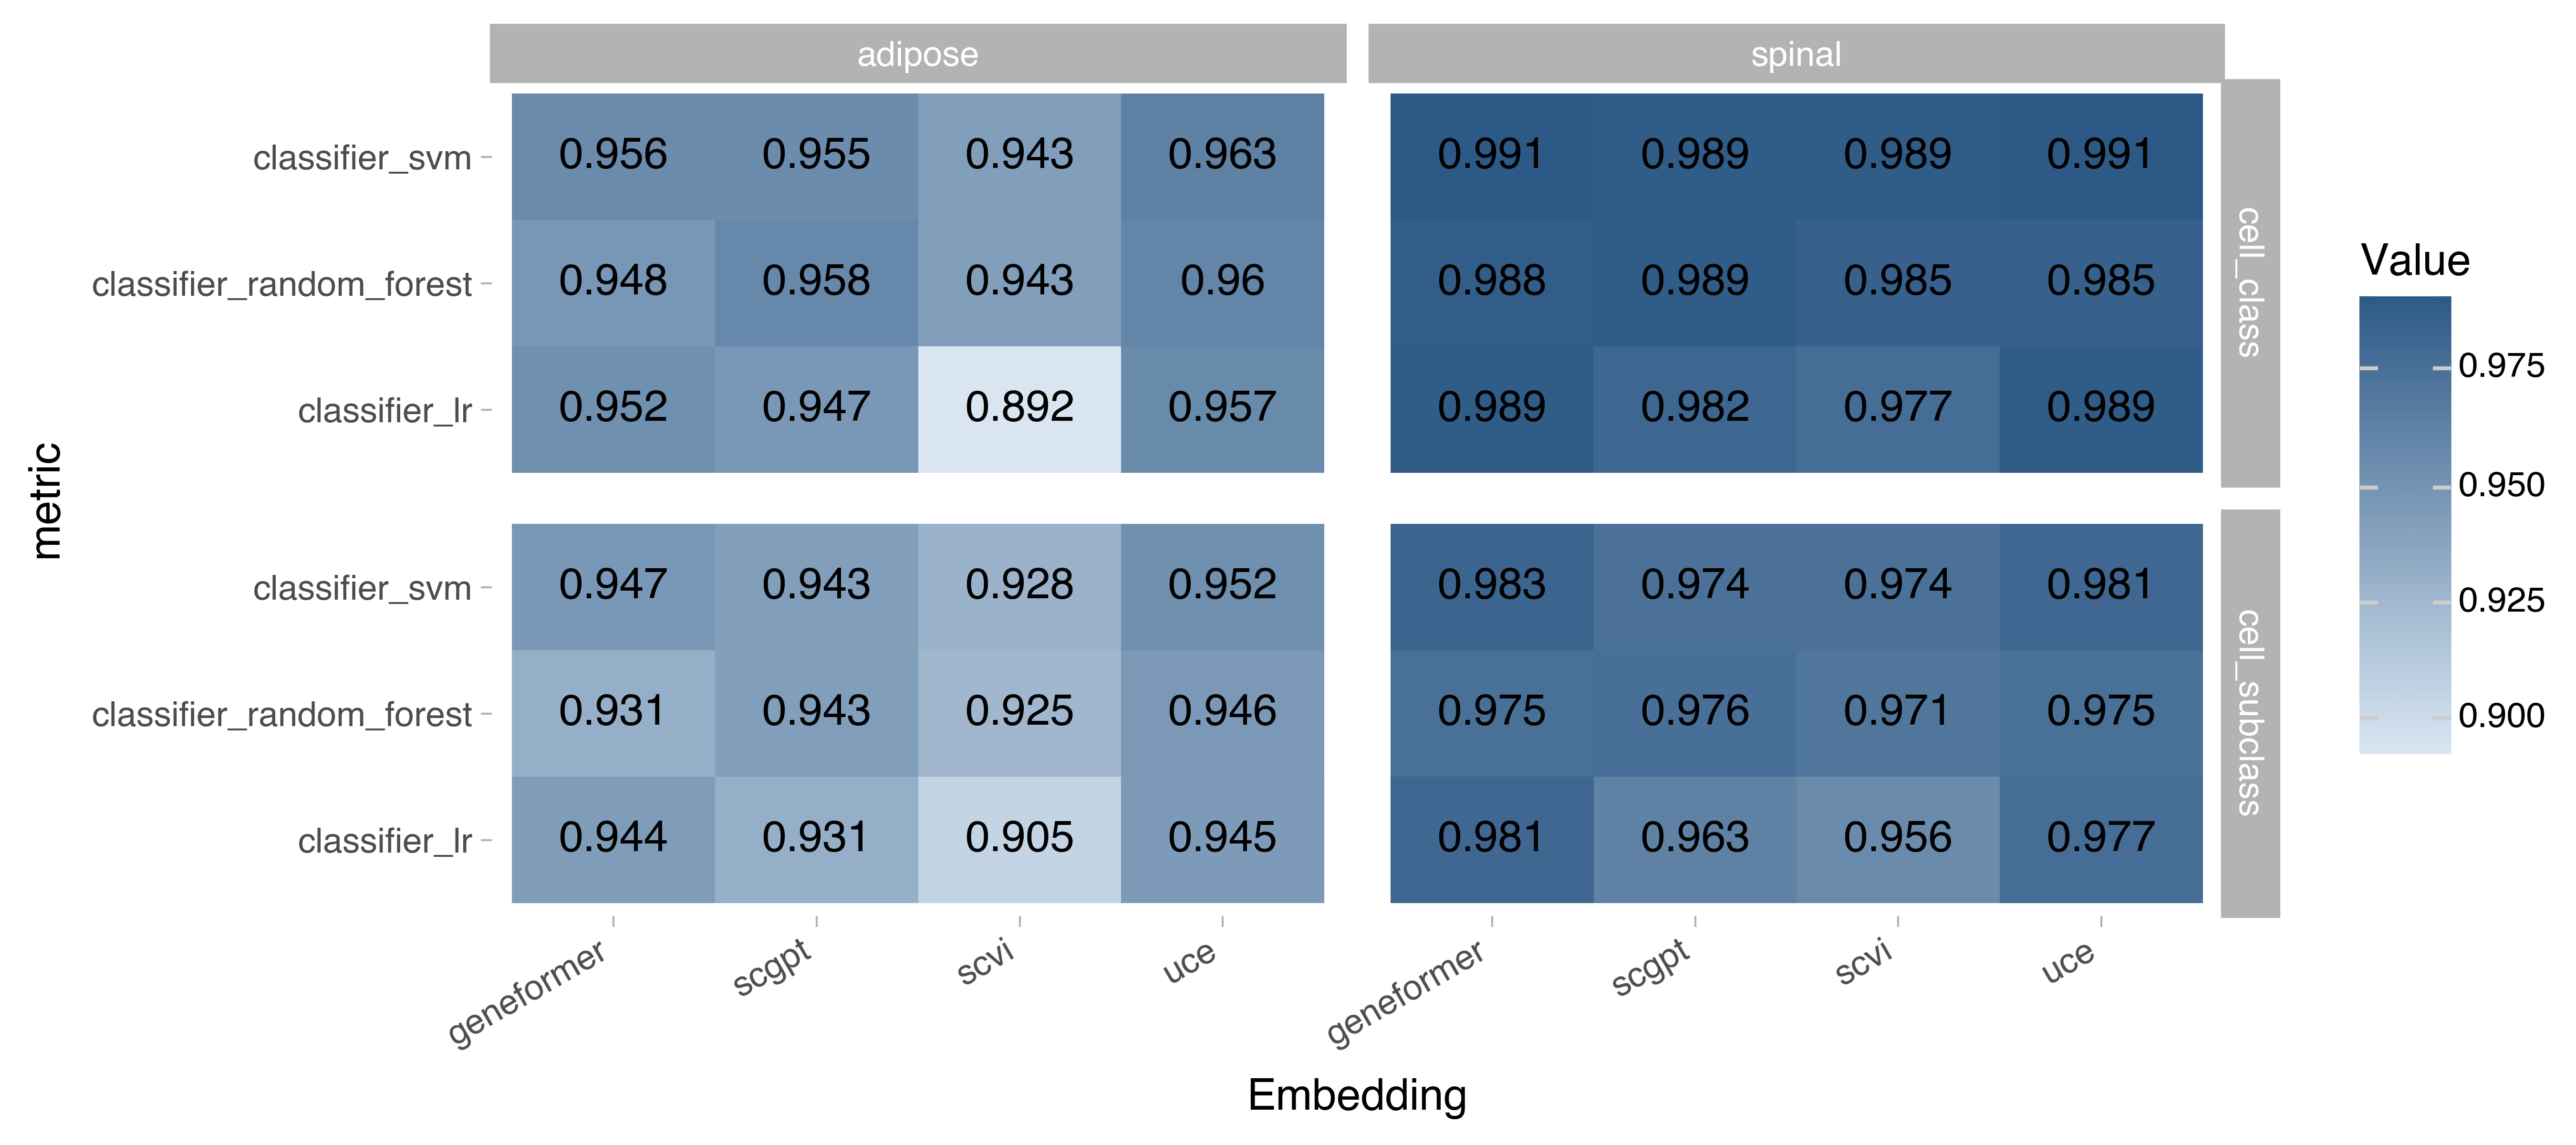
The bio-conservation metrics were run the in following biological labels in a Census cells from Adipose Tissue and Spinal Cord:
Cell subclass: a higher definition of a cell type with maximum of 73 unique labels, as defined on the CELLxGENE collection page.
Cell class: an even higher definition of a cell type with a maximum of 22 unique labels, also defined on the CELLxGENE collection page.

Figure 2. Bio-conservation metrics on the embedding space. Higher values signify better performance, max value for all metrics is 1.

Figure 3. Bio-conservation metrics based on label classifiers. Values represent label prediction accuracy. Higher values signify better performance, max value for all metrics is 1.
Batch-correction
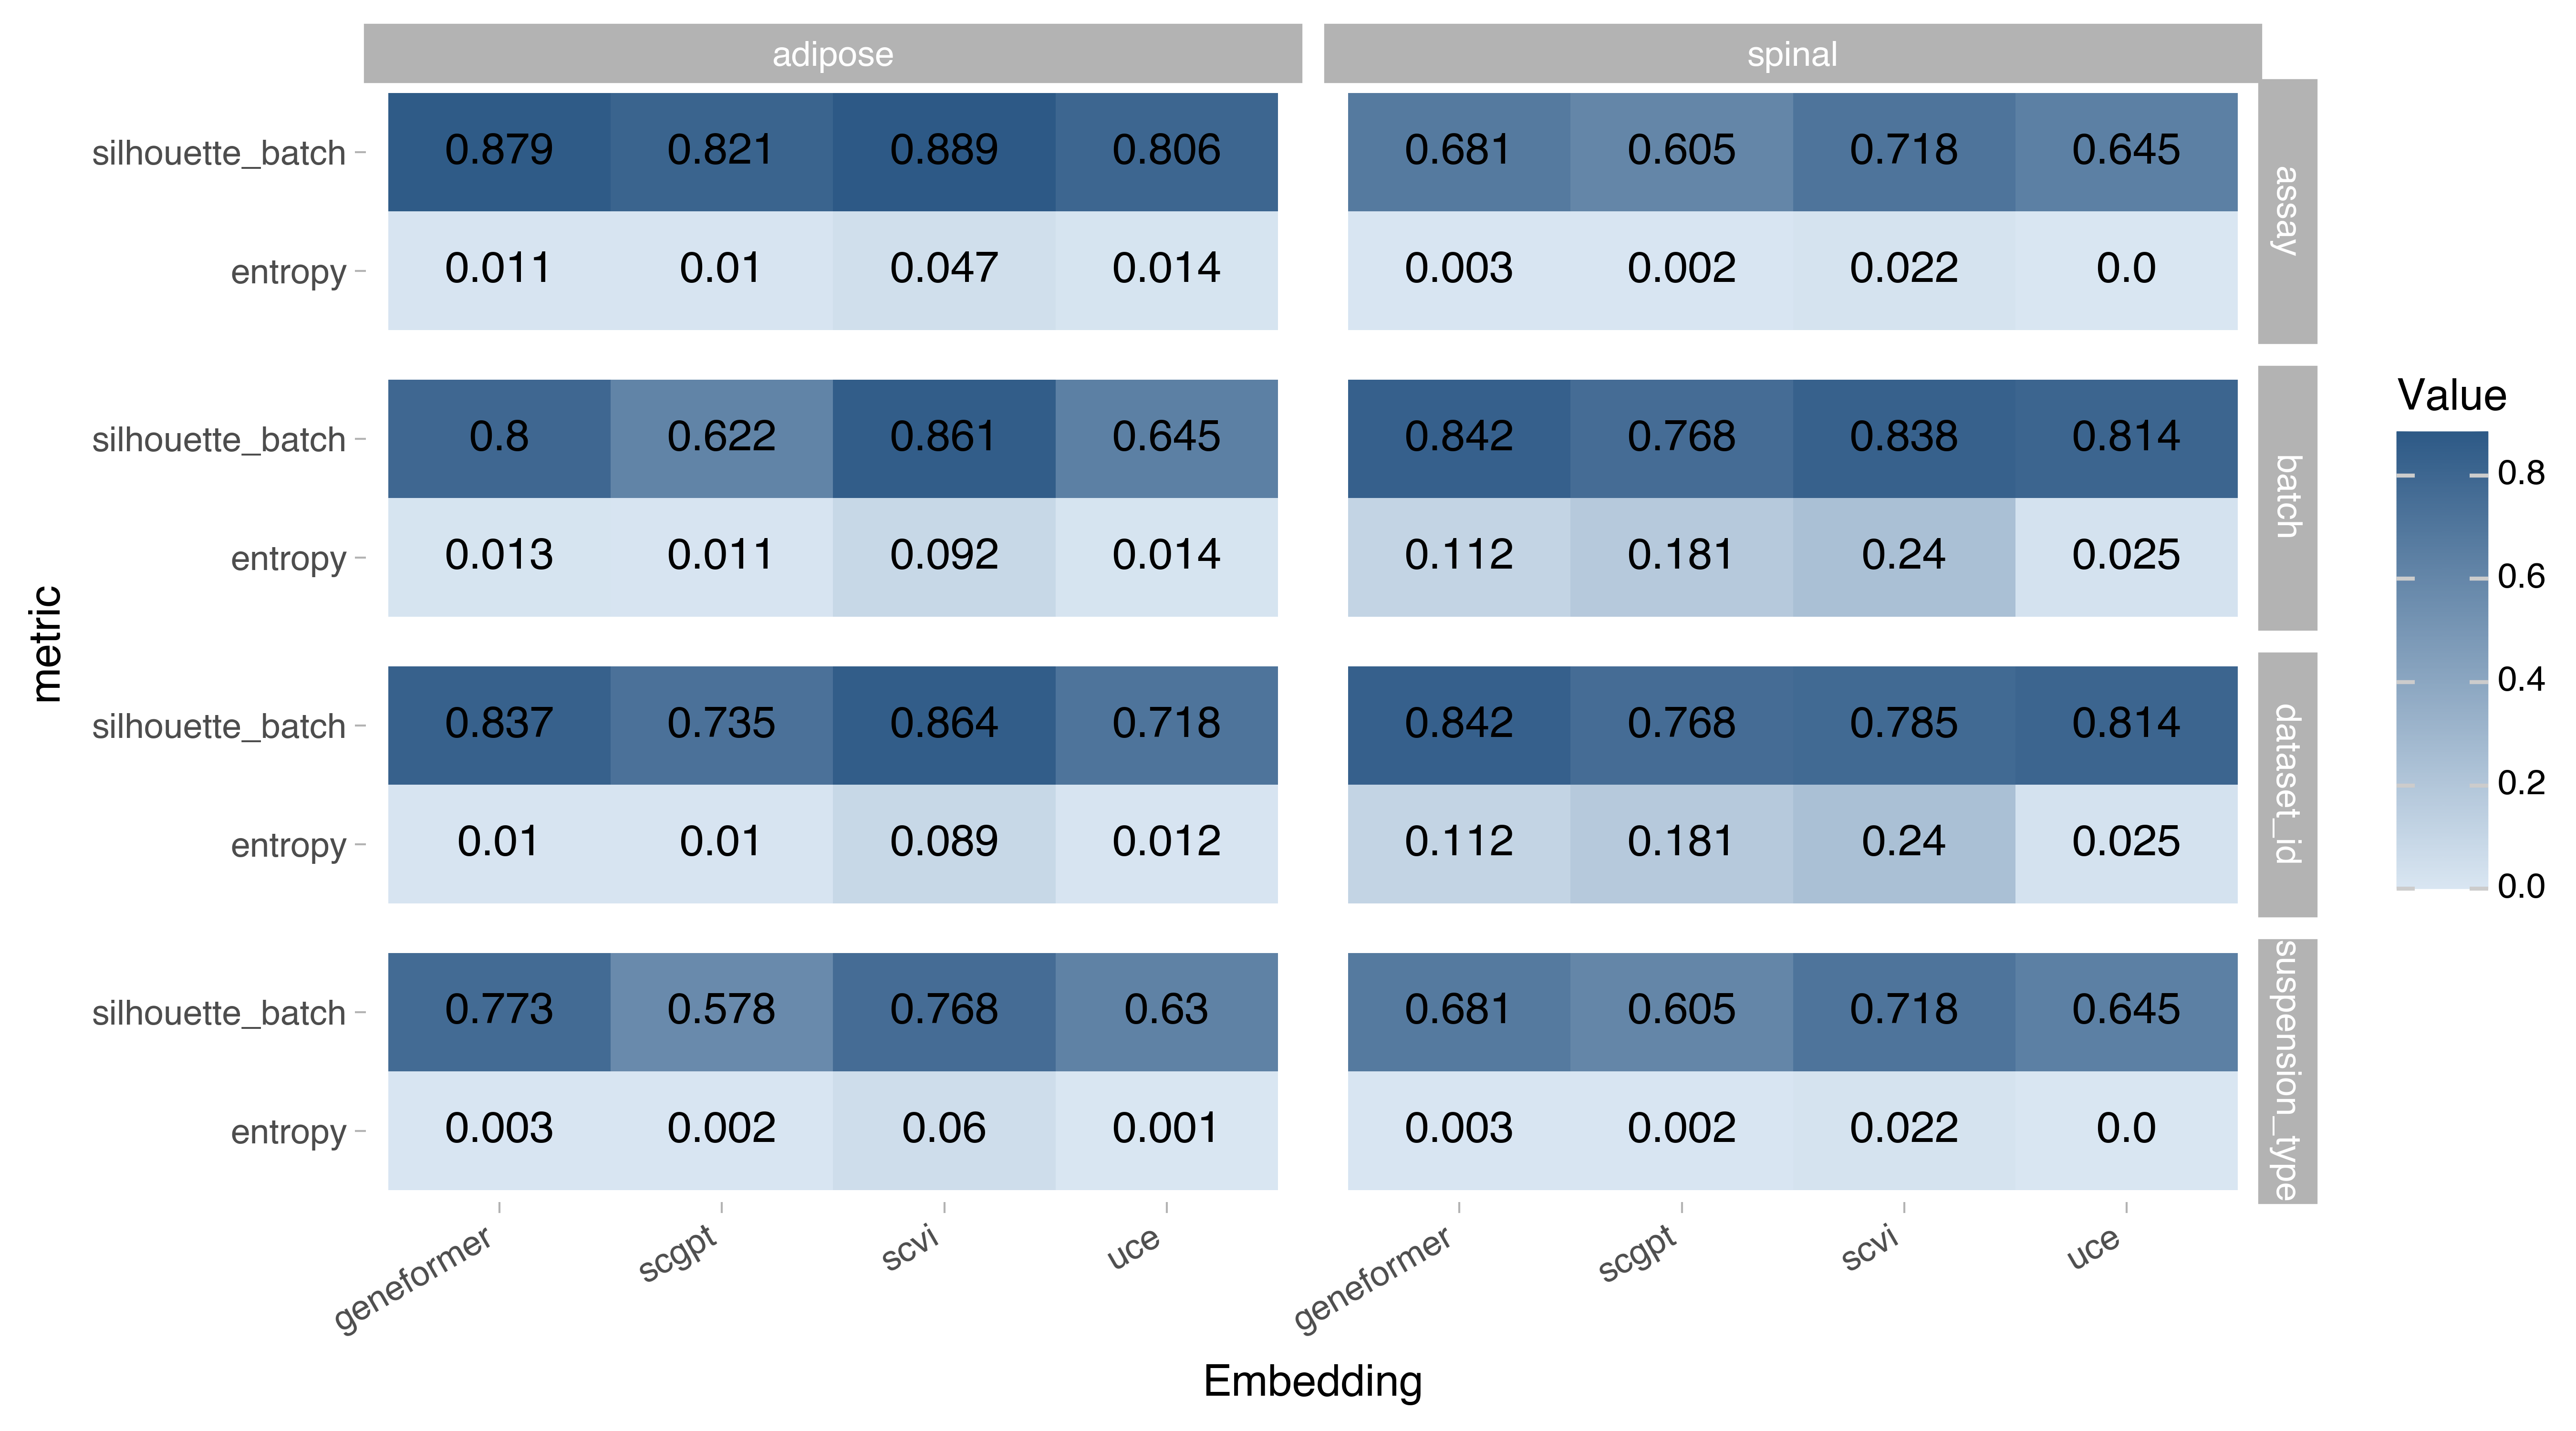
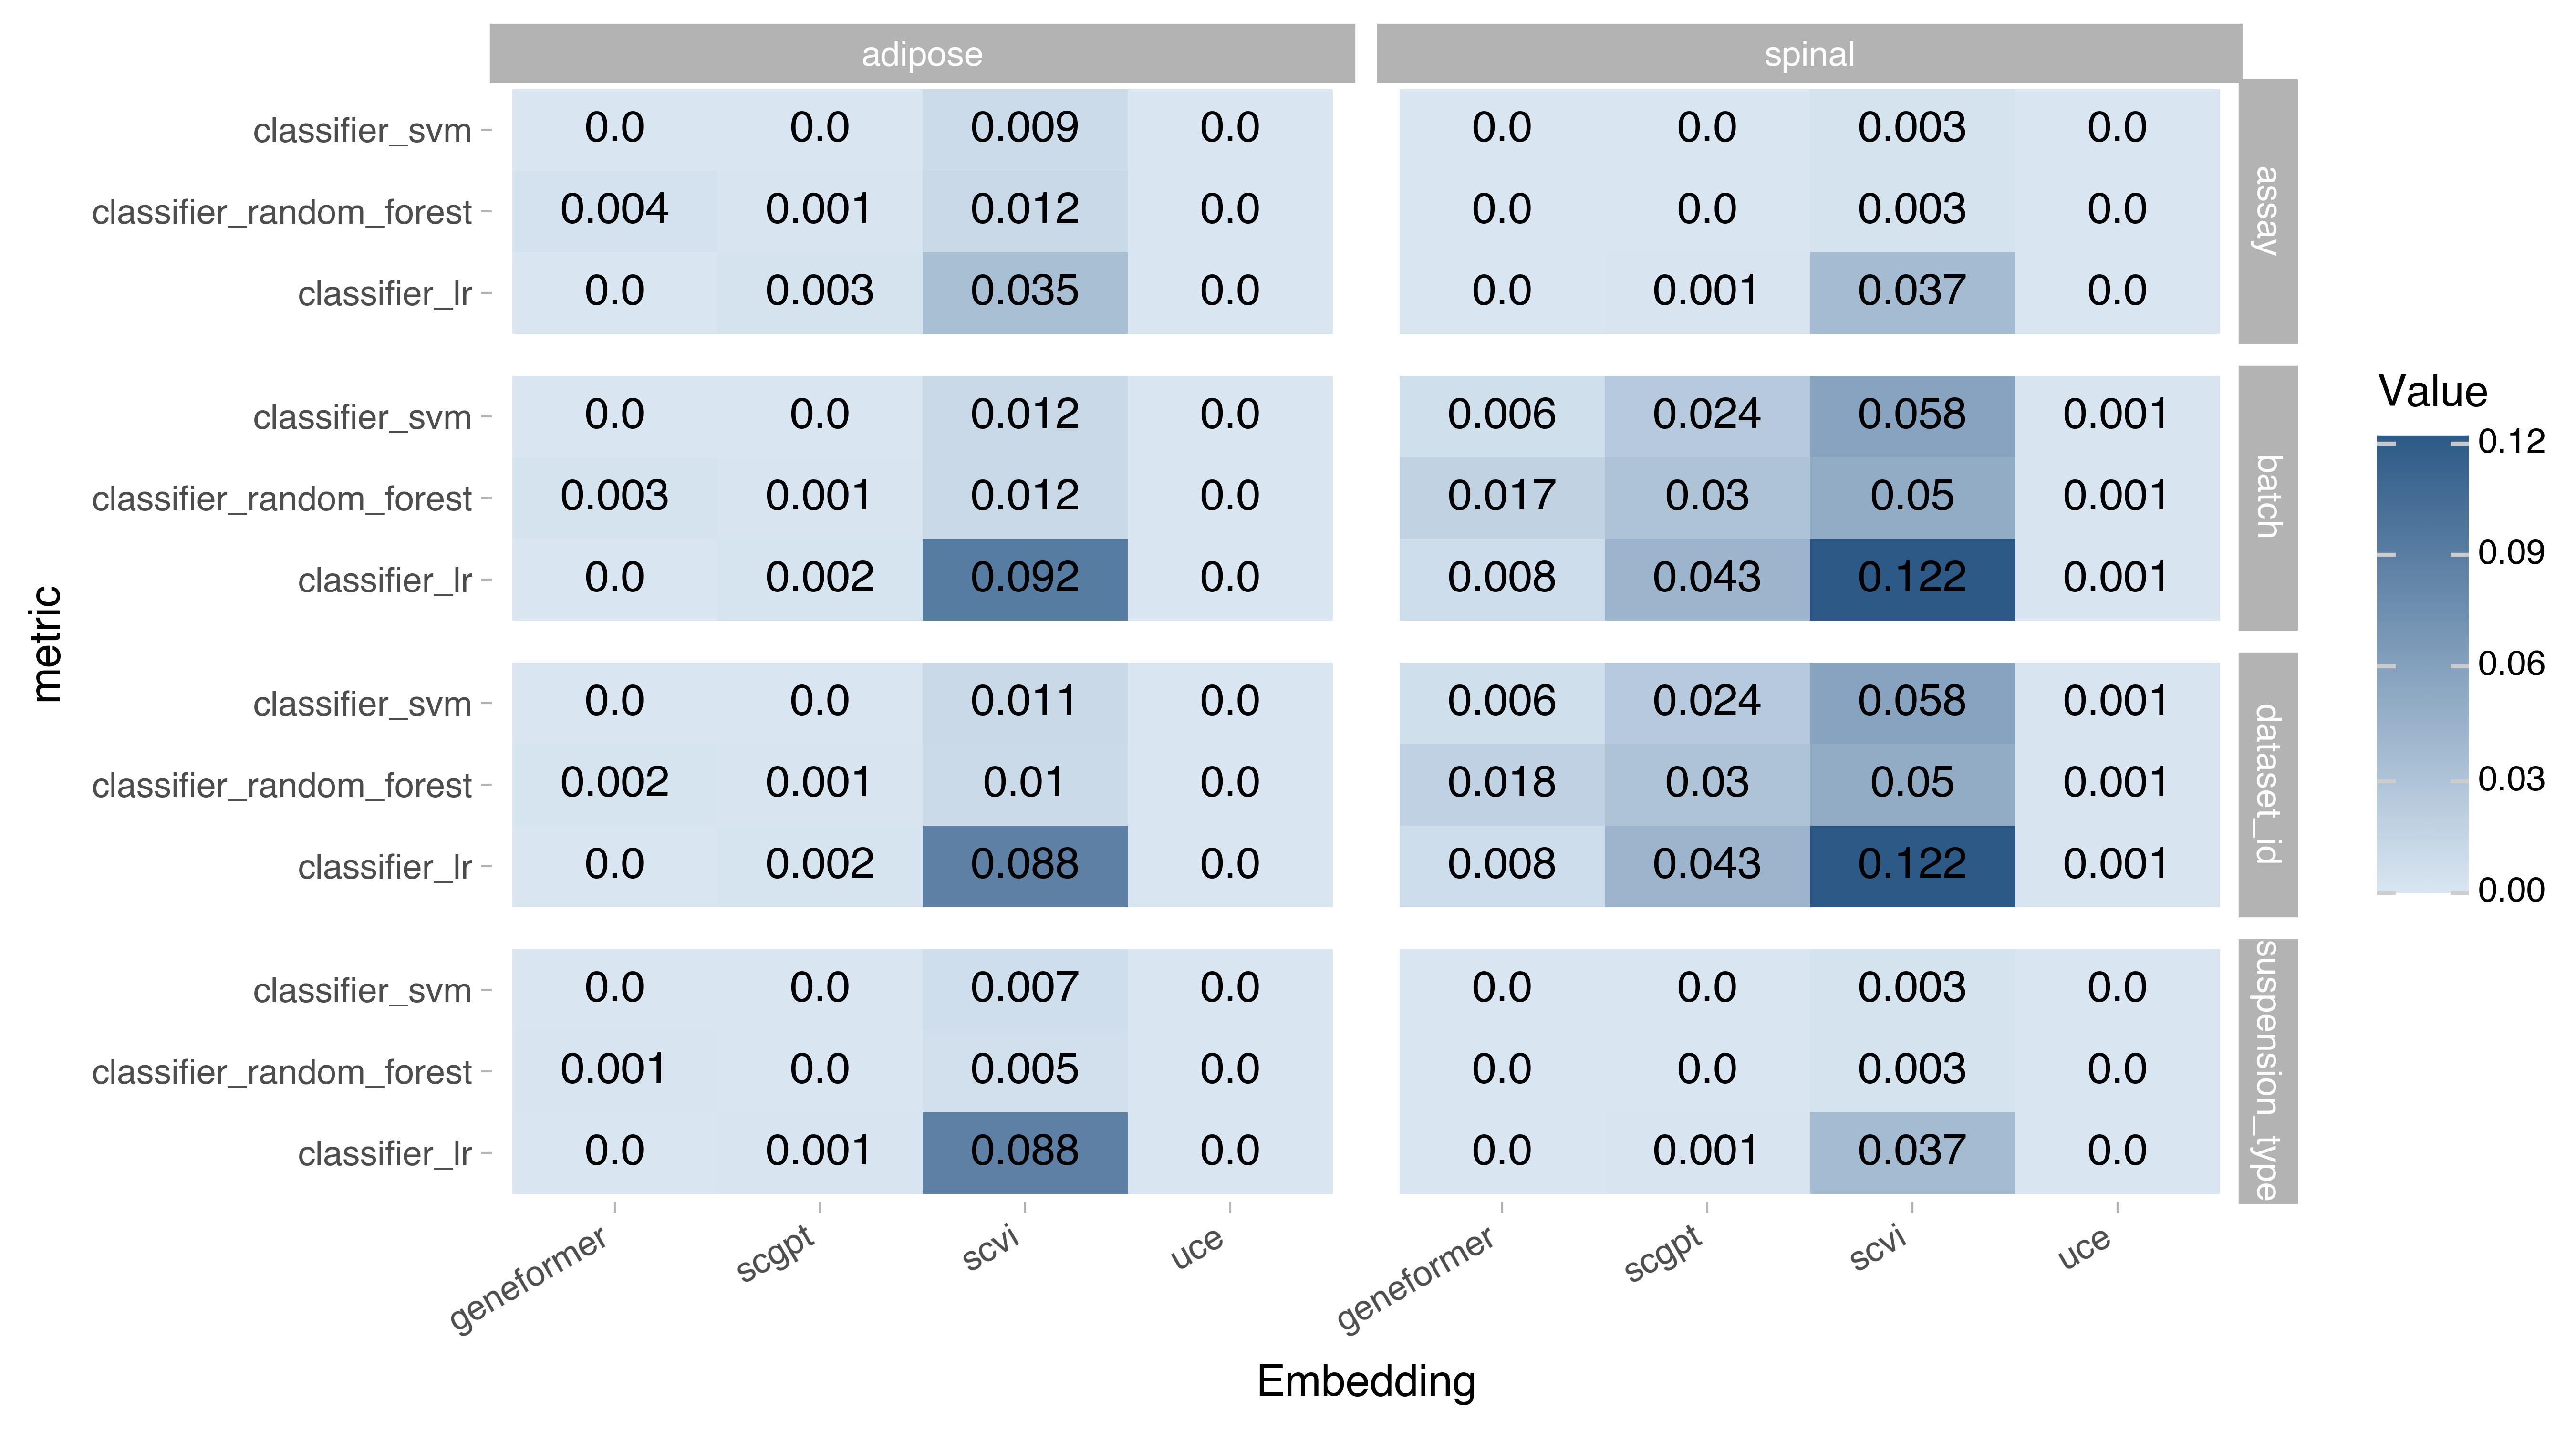
The batch-correction metrics were run the in following batch labels in a Census cells from Adipose Tissue and Spinal Cord:
Assay: the sequencing technology.
Dataset: the dataset from which the cell originated from.
Suspension type: cell vs nucleus.
Batch: the concatenation of values for all of the above.

Figure 4. Batch-correction metrics on the embedding space. Higher values signify better performance, max value for silhouette_batch is 1, entropy values should only be compared within the tissue/label combination and not across.

Figure 5. Batch-correction metrics based on label classifiers. Values represent 1 - label prediction accuracy. In theory higher values signify better performance indicating that prediction of batch labels is not accurate. However foundation models may be designed to learn all information including technical variation, please refer to the original publications of the models to learn more about them.
Source data
All data was obtained from the Census API, to fetch the data used in this report you can execute the following in Python. To get the cell subclass and cell class please refer to the CellxGene Ontology Guide API.
import cellxgene_census

val_filters = {
   "adipose": "tissue_general == 'adipose tissue' and is_primary_data == True",
   "spinal": "tissue_general == 'spinal cord' and is_primary_data == True",
}

embedding_names = ["geneformer", "scgpt", "scvi", "uce"]
embedding_names = ["scvi"]
column_names = {
   "obs": ["cell_type_ontology_term_id", "cell_type", "assay", "suspension_type", "dataset_id", "soma_joinid"]
}

census = cellxgene_census.open_soma(census_version="2023-12-15")

adatas = []
for tissue in val_filters:
    adatas.append(
       cellxgene_census.get_anndata(
           census,
           organism="homo_sapiens",
           measurement_name="RNA",
           obs_value_filter= val_filters[tissue],
           obs_embeddings=embedding_names,
           column_names=column_names,
        )
    )
Batch label counts
The following shows the batch label counts per tissue:
Adipose tissue
| Type | Label | Count |
|---|---|---|
| Assay | 10x 3' v3 | 91947 |
| 10x 5' transcription profiling | 2121 | |
| microwell-seq | 5916 | |
| Smart-seq2 | 651 | |
| Suspension Type | nucleus | 72335 |
| cell | 23756 | |
| Dataset | 9d8e5dca-03a3-457d-b7fb-844c75735c83 | 72335 |
| 53d208b0-2cfd-4366-9866-c3c6114081bc | 20263 | |
| 5af90777-6760-4003-9dba-8f945fec6fdf | 2121 | |
| 2adb1f8a-a6b1-4909-8ee8-484814e2d4bf | 1372 |
Spinal cord
| Type | Label | Count |
|---|---|---|
| Assay | 10x 3' v3 | 43840 |
| microwell-seq | 5916 | |
| Suspension Type | nucleus | 43840 |
| cell | 5916 | |
| Dataset | 090da8ea-46e8-40df-bffc-1f78e1538d27 | 24190 |
| c05e6940-729c-47bd-a2a6-6ce3730c4919 | 19650 | |
| 2adb1f8a-a6b1-4909-8ee8-484814e2d4bf | 5916 |
